

In this post, I’ll explain how to initially setup a SIEM so you can receive your first logs.
Note: In this post I use Logz.io for my examples, but I recently switched to Humio. For more details: https://www.tristandostaler.com/why-i-switched-from-logz-io-to-humio/
This is the second post of the series “SIEM 101″ where I explain the basics of a SIEM, from installation to simple usage. You can see the previous post SIEM 101 — Introduction.
I decided to write the series using Logz.io because they offer an easy to use platform with a free 1GB/day trial with a smooth learning curve. Of course they don’t offer all the features in the free version and some crucial features for a SIEM are missing, but this is perfect to get started with a SIEM! For the Splunk fans, I’ll probably write a blog post about why I don’t recommend it often and why I recommend an Elasticsearch based SIEM most of the time.
First step: open an account
The first thing to do is to open an account on Logz.io. They offer to open an account using your google account, or to register with an email. For this demo I’ll use the google SSO option. So head over to Logz.io and register:
https://app.logz.io/#/login
Next, click on “Sign in with Google”:

You’ll get redirected to the Google SSO. Select your existing account, login or create an account. I’ll let you figure this part out.
Then, once back on the Logz.io website, you get a Sign up page. Fill out the details and click “Create Account”:
Note: It is smart to choose a region close to where you live to get better bandwidth when sending logs.
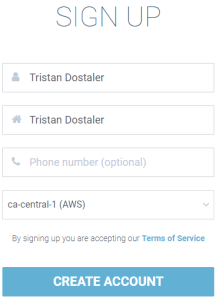
That’s it, your account is ready to receive logs! When you login, you can follow their tutorial if you want to. The next step in this post is pretty much the same thing as their tutorial.
Second step: start sending logs
Now that we have an account, we can finally start sending logs. Make sure you are logged in your account for the next steps. I divided this section in two, one for Windows and one for Linux (I use Ubuntu).
Once logged in, click on “Send Your Data” in the top navigation:

The next steps are starting to get interesting. We’ll configure the log shipper agents on Windows and Ubuntu.
Windows
On the left navigation, close “Log Shippers” that should be opened, and open “Operating Systems”:
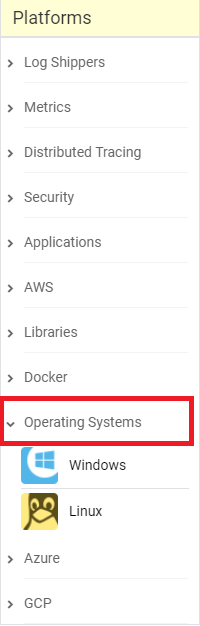
Select “Windows” under the “Operating Systems” menu. Your page will refresh to the URL
https://app.logz.io/#/dashboard/data-sources/Windows
They propose 2 options; we are interested in the option 1: Winlogbeat.
As they explain in the page, you first need to install Winlogbeat. So that’s what we’ll do.
Head over to https://www.elastic.co/downloads/beats/winlogbeat-oss and download the right MSI version for your computer (32 bits or 64 bits, if unsure use the 32 bits). For me, that’s the 64 bits MSI:
Note: here, my link is slightly different than the one they propose on their website. This is because I recommend using the OpenSource version (oss).

When the download is finished, click the downloaded file, a window will open.
Check the “I accept the terms in the License Agreement” checkbox and click “Install”:
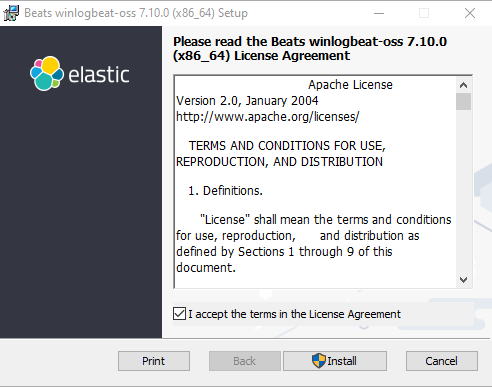
When prompted, accept to run as Administrator (UAC). When the installation is done, click Finish (we leave the checkbox “Open winlogbeat data directory in Windows Explorer” checked.
In the Windows Exporer window that opened at the location “C:\ProgramData\Elastic\Beats\winlogbeat”, rename the file “winlogbeat.example.yml” to “winlogbeat.yml”.
Open your favorite text editor (it can be Notepad, I use VSCode) as Administrator (right click, Run As Administrator) and then open the file “winlogbeat.yml”.
Replace all the content of the file with the content from this gist:
| ###################### Winlogbeat Configuration Example ######################## | |
| # This file is an example configuration file highlighting only the most common | |
| # options. The winlogbeat.reference.yml file from the same directory contains | |
| # all the supported options with more comments. You can use it as a reference. | |
| # | |
| # You can find the full configuration reference here: | |
| # https://www.elastic.co/guide/en/beats/winlogbeat/index.html | |
| #======================= Winlogbeat specific options =========================== | |
| # event_logs specifies a list of event logs to monitor as well as any | |
| # accompanying options. The YAML data type of event_logs is a list of | |
| # dictionaries. | |
| # | |
| # The supported keys are name (required), tags, fields, fields_under_root, | |
| # forwarded, ignore_older, level, event_id, provider, and include_xml. Please | |
| # visit the documentation for the complete details of each option. | |
| # https://go.es.io/WinlogbeatConfig | |
| winlogbeat.event_logs: | |
| - name: Application | |
| ignore_older: 72h | |
| - name: Security | |
| ignore_older: 72h | |
| - name: System | |
| ignore_older: 72h | |
| - name: Microsoft-Windows-Sysmon/Operational | |
| ignore_older: 72h | |
| - name: Microsoft-Windows-Windows Defender/Operational | |
| ignore_older: 72h | |
| - name: Microsoft-Windows-RemoteDesktopServices-RdpCoreTS/Admin | |
| ignore_older: 72h | |
| - name: Microsoft-Windows-RemoteDesktopServices-RdpCoreTS/Operational | |
| ignore_older: 72h | |
| - name: Microsoft-Windows-TerminalServices-RemoteConnectionManager/Admin | |
| ignore_older: 72h | |
| - name: Microsoft-Windows-TerminalServices-RemoteConnectionManager/Operational | |
| ignore_older: 72h | |
| - name: Microsoft-Windows-RemoteApp and Desktop Connections/Admin | |
| ignore_older: 72h | |
| - name: Microsoft-Windows-TerminalServices-ClientUSBDevices/Admin | |
| ignore_older: 72h | |
| - name: Microsoft-Windows-TerminalServices-LocalSessionManager/Admin | |
| ignore_older: 72h | |
| - name: Microsoft-Windows-TerminalServices-LocalSessionManager/Operational | |
| ignore_older: 72h | |
| - name: Microsoft-Windows-TerminalServices-PnPDevices/Admin | |
| ignore_older: 72h | |
| - name: Microsoft-Windows-TerminalServices-Printers/Admin | |
| ignore_older: 72h | |
| - name: Microsoft-Windows-TerminalServices-ServerUSBDevices/Admin | |
| ignore_older: 72h | |
| - name: Microsoft-Windows-TerminalServices-SessionBroker-Client/Admin | |
| ignore_older: 72h | |
| - name: Microsoft-Windows-VerifyHardwareSecurity/Admin | |
| ignore_older: 72h | |
| fields: | |
| logzio_codec: json | |
| token: YOURTOKEN_PLACEHOLDER | |
| type: wineventlog | |
| fields_under_root: true | |
| #==================== Elasticsearch template settings ========================== | |
| setup.template.settings: | |
| index.number_of_shards: 1 | |
| #index.codec: best_compression | |
| #_source.enabled: false | |
| #================================ General ===================================== | |
| # The name of the shipper that publishes the network data. It can be used to group | |
| # all the transactions sent by a single shipper in the web interface. | |
| #name: | |
| # The tags of the shipper are included in their own field with each | |
| # transaction published. | |
| #tags: ["service-X", "web-tier"] | |
| # Optional fields that you can specify to add additional information to the | |
| # output. | |
| #fields: | |
| # env: staging | |
| #============================== Dashboards ===================================== | |
| # These settings control loading the sample dashboards to the Kibana index. Loading | |
| # the dashboards is disabled by default and can be enabled either by setting the | |
| # options here or by using the `setup` command. | |
| #setup.dashboards.enabled: false | |
| # The URL from where to download the dashboards archive. By default this URL | |
| # has a value which is computed based on the Beat name and version. For released | |
| # versions, this URL points to the dashboard archive on the artifacts.elastic.co | |
| # website. | |
| #setup.dashboards.url: | |
| #============================== Kibana ===================================== | |
| # Starting with Beats version 6.0.0, the dashboards are loaded via the Kibana API. | |
| # This requires a Kibana endpoint configuration. | |
| setup.kibana: | |
| # Kibana Host | |
| # Scheme and port can be left out and will be set to the default (http and 5601) | |
| # In case you specify and additional path, the scheme is required: http://localhost:5601/path | |
| # IPv6 addresses should always be defined as: https://[2001:db8::1]:5601 | |
| #host: "localhost:5601" | |
| # Kibana Space ID | |
| # ID of the Kibana Space into which the dashboards should be loaded. By default, | |
| # the Default Space will be used. | |
| #space.id: | |
| #============================= Elastic Cloud ================================== | |
| # These settings simplify using Winlogbeat with the Elastic Cloud (https://cloud.elastic.co/). | |
| # The cloud.id setting overwrites the `output.elasticsearch.hosts` and | |
| # `setup.kibana.host` options. | |
| # You can find the `cloud.id` in the Elastic Cloud web UI. | |
| #cloud.id: | |
| # The cloud.auth setting overwrites the `output.elasticsearch.username` and | |
| # `output.elasticsearch.password` settings. The format is `<user>:<pass>`. | |
| #cloud.auth: | |
| #================================ Outputs ===================================== | |
| # Configure what output to use when sending the data collected by the beat. | |
| #-------------------------- Elasticsearch output ------------------------------ | |
| #output.elasticsearch: | |
| # Array of hosts to connect to. | |
| # hosts: [""] | |
| # password: "" | |
| # Protocol - either `http` (default) or `https`. | |
| #protocol: "https" | |
| # Authentication credentials - either API key or username/password. | |
| #api_key: "id:api_key" | |
| #username: "elastic" | |
| #password: "changeme" | |
| #----------------------------- Logstash output -------------------------------- | |
| #output.logstash: | |
| # The Logstash hosts | |
| #hosts: ["localhost:5044"] | |
| output.logstash: | |
| hosts: ["listener.logz.io:5015"] | |
| ssl: | |
| certificate_authorities: ['C:\ProgramData\Winlogbeat\COMODORSADomainValidationSecureServerCA.crt'] | |
| # Optional SSL. By default is off. | |
| # List of root certificates for HTTPS server verifications | |
| #ssl.certificate_authorities: ["/etc/pki/root/ca.pem"] | |
| # Certificate for SSL client authentication | |
| #ssl.certificate: "/etc/pki/client/cert.pem" | |
| # Client Certificate Key | |
| #ssl.key: "/etc/pki/client/cert.key" | |
| #================================ Processors ===================================== | |
| # Configure processors to enhance or manipulate events generated by the beat. | |
| # ... For Winlogbeat 7 only ... | |
| processors: | |
| - rename: | |
| fields: | |
| - from: "agent" | |
| to: "beat_agent" | |
| ignore_missing: true | |
| - rename: | |
| fields: | |
| - from: "log.file.path" | |
| to: "source" | |
| ignore_missing: true | |
| - rename: | |
| fields: | |
| - from: "log" | |
| to: "log_information" | |
| ignore_missing: true | |
| #================================ Logging ===================================== | |
| # Sets log level. The default log level is info. | |
| # Available log levels are: error, warning, info, debug | |
| #logging.level: debug | |
| # At debug level, you can selectively enable logging only for some components. | |
| # To enable all selectors use ["*"]. Examples of other selectors are "beat", | |
| # "publish", "service". | |
| #logging.selectors: ["*"] | |
| #============================== X-Pack Monitoring =============================== | |
| # winlogbeat can export internal metrics to a central Elasticsearch monitoring | |
| # cluster. This requires xpack monitoring to be enabled in Elasticsearch. The | |
| # reporting is disabled by default. | |
| # Set to true to enable the monitoring reporter. | |
| #monitoring.enabled: false | |
| # Sets the UUID of the Elasticsearch cluster under which monitoring data for this | |
| # Winlogbeat instance will appear in the Stack Monitoring UI. If output.elasticsearch | |
| # is enabled, the UUID is derived from the Elasticsearch cluster referenced by output.elasticsearch. | |
| #monitoring.cluster_uuid: | |
| # Uncomment to send the metrics to Elasticsearch. Most settings from the | |
| # Elasticsearch output are accepted here as well. | |
| # Note that the settings should point to your Elasticsearch *monitoring* cluster. | |
| # Any setting that is not set is automatically inherited from the Elasticsearch | |
| # output configuration, so if you have the Elasticsearch output configured such | |
| # that it is pointing to your Elasticsearch monitoring cluster, you can simply | |
| # uncomment the following line. | |
| #monitoring.elasticsearch: | |
| #================================= Migration ================================== | |
| # This allows to enable 6.7 migration aliases | |
| #migration.6_to_7.enabled: true | |
In this content, you’ll find the text “YOURTOKEN_PLACEHOLDER”; replace this with the token they provide in the Logz.io settings page in the section “Account settings”:
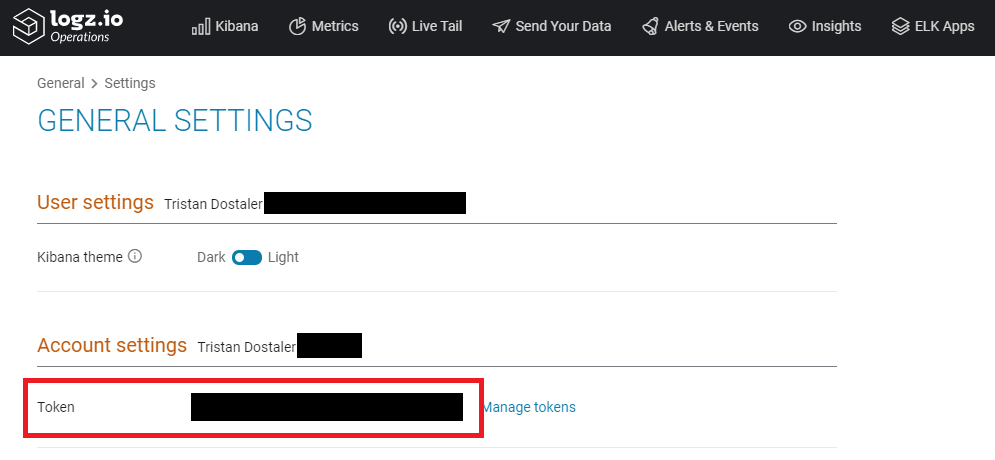
Becareful, this token is secret! If someone get his/her hand on this token, they can send fake data to your account and overload it with garbage data.
Now, download the Logz.io public certificate and place it in “C:\ProgramData\Winlogbeat\COMODORSADomainValidationSecureServerCA.crt“. This certificate is available at https://raw.githubusercontent.com/logzio/public-certificates/master/AAACertificateServices.crt. You’ll need to do this using your text editor as Administrator.
When this is done, run the following command in a PowerShell window as Administrator: Restart-Service winlogbeat
That’s it, you should now receive your Windows logs in Logz.io! Head over to “Kibana” to see them come in (click “Refresh” if you don’t see them right away).

Note: You might have noticed that in the winlogbeat.yml I enabled logging of Sysmon. I plan to make a blog post to explain what is Sysmon and how to use it. For the moment, it doesn’t mather if Sysmon is not installed, Winlogbeat will simply ignore this config line.
Hint: You can enable the Dark Theme for Kibana in the Logz.io settings page
Ubuntu
Note: There is a TL;DR; section at the end. For this section, I assume you know how to use the Command Line Interface (CLI). For Ubuntu, we will be using Filebeat. By default, if you send logs using rsyslog, the data will not be encrypted over the internet, which is not recomended. By using filebeat, we can send encrypted data easily. On the left navigation, in “Log Shippers” that should be opened (if not, open it), click on “Filebeat”. As they explain in the page, you first need to install Filebeat. So that’s what we’ll do. Run the following commands: Note: here, my link is slightly different than the one they propose on their website. This is because I recommend using the OpenSource version (oss).
curl -L -O https://artifacts.elastic.co/downloads/beats/filebeat/filebeat-oss-7.10.0-amd64.deb
sudo dpkg -i filebeat-oss-7.10.0-amd64.deb
rm filebeat-oss-7.10.0-amd64.deb
We also need the Logz.io public certificate. Run the following command:
sudo curl https://raw.githubusercontent.com/logzio/public-certificates/master/AAACertificateServices.crt --create-dirs -o /etc/pki/tls/certs/COMODORSADomainValidationSecureServerCA.crtNext, we’ll configure filebeat to ship the logs to Logz.io using my default template and some bash-foo. When asked for the token, provide the token available in the Logz.io settings page in the section “Account settings”:
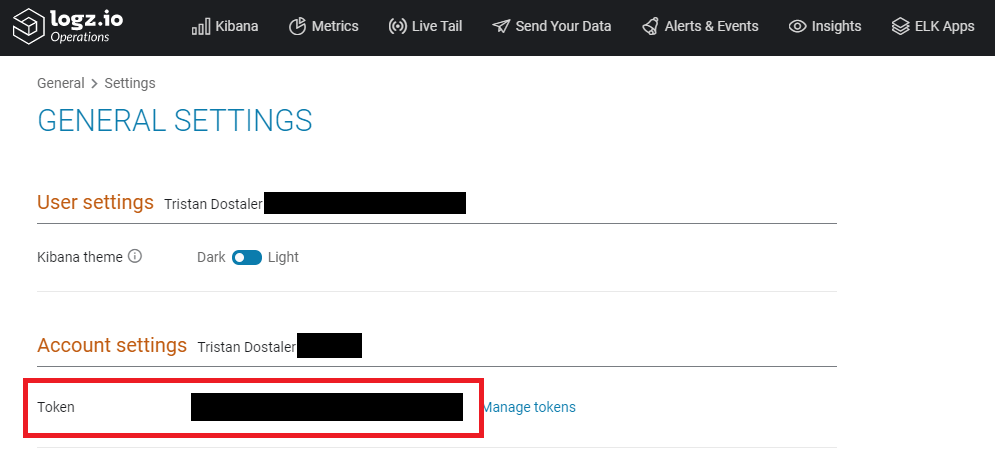
Becareful, this token is secret! If someone get his/her hand on this token, they can send fake data to your account and overload it with garbage data.
Run the following commands:
sudo curl https://gist.githubusercontent.com/tristandostaler/7a212a0ba23b97c97a5e2c6925bde240/raw/72c90076cf4aa16179c123316b3ef8cec775d576/filebeat.yml --create-dirs -o /etc/filebeat/filebeat.yml
echo -n "Please enter your logz.io Token: " && read -s LOGZ_TOKEN && sudo sed -i "s|YOURTOKEN_PLACEHOLDER|$LOGZ_TOKEN|g" /etc/filebeat/filebeat.yml
Now we only need to start FIlebeat and the logs will start shipping! Run the following command:
sudo systemctl start filebeat || sudo service filebeat start
(sudo systemctl enable filebeat) || (sudo update-rc.d filebeat defaults && sudo update-rc.d filebeat enable)
That’s it, you should now receive your Ubuntu logs in Logz.io! Head over to “Kibana” to see them come in (click “Refresh” if you don’t see them right away).

Note: You might have noticed that in the filebeat.yml I enabled logging of many systems that are not installed by default, like auditd. I plan to make a blog post to explain what is auditd and how to use it. For the moment, it doesn’t mather if auditd is not installed, filebeat will simply ignore this config line.
Hint: You can enable the Dark Theme for Kibana in the Logz.io settings page
TL;DR; putting all the commands together:
curl -L -O https://artifacts.elastic.co/downloads/beats/filebeat/filebeat-oss-7.10.0-amd64.deb
sudo dpkg -i filebeat-oss-7.10.0-amd64.deb
rm filebeat-oss-7.10.0-amd64.deb
sudo curl https://raw.githubusercontent.com/logzio/public-certificates/master/AAACertificateServices.crt --create-dirs -o /etc/pki/tls/certs/COMODORSADomainValidationSecureServerCA.crt
sudo curl https://gist.githubusercontent.com/tristandostaler/7a212a0ba23b97c97a5e2c6925bde240/raw/72c90076cf4aa16179c123316b3ef8cec775d576/filebeat.yml --create-dirs -o /etc/filebeat/filebeat.yml
echo -n "Please enter your logz.io Token: " && read -s LOGZ_TOKEN && sudo sed -i "s|YOURTOKEN_PLACEHOLDER|$LOGZ_TOKEN|g" /etc/filebeat/filebeat.yml
sudo systemctl start filebeat || sudo service filebeat start
(sudo systemctl enable filebeat) || (sudo update-rc.d filebeat defaults && sudo update-rc.d filebeat enable)
Conclusion
That’s it, you now have your initial setup for a SIEM, with logs being sent! Of course, at the moment there are no alerts and the platform we are using don’t offer all the features we would like from a SIEM. But this is perfect to start learning to use a SIEM! In the next blog post SIEM 101 — Basic usage, I explain the basic usage of Logz.io, how to search logs, how to create an alert, etc.
Feel free to leave your comment down here for any questions or comments.
Donation
If you like my blog and my posts, please consider donating! Imagine this: each minute of reading a post takes about 1-2 hours to create!